
Malta from Space
Over the past few years, I’ve been processing satellite imagery of the Maltese Islands. This collection features true-colour images along with additional derived products from satellite data.
Weather Overview from Yesterday
15-minute interval images of Europe and Northern Africa from SEVIRI instrument - Meteosat Second Generation (MSG), EUMETSAT.
True-Colour Images
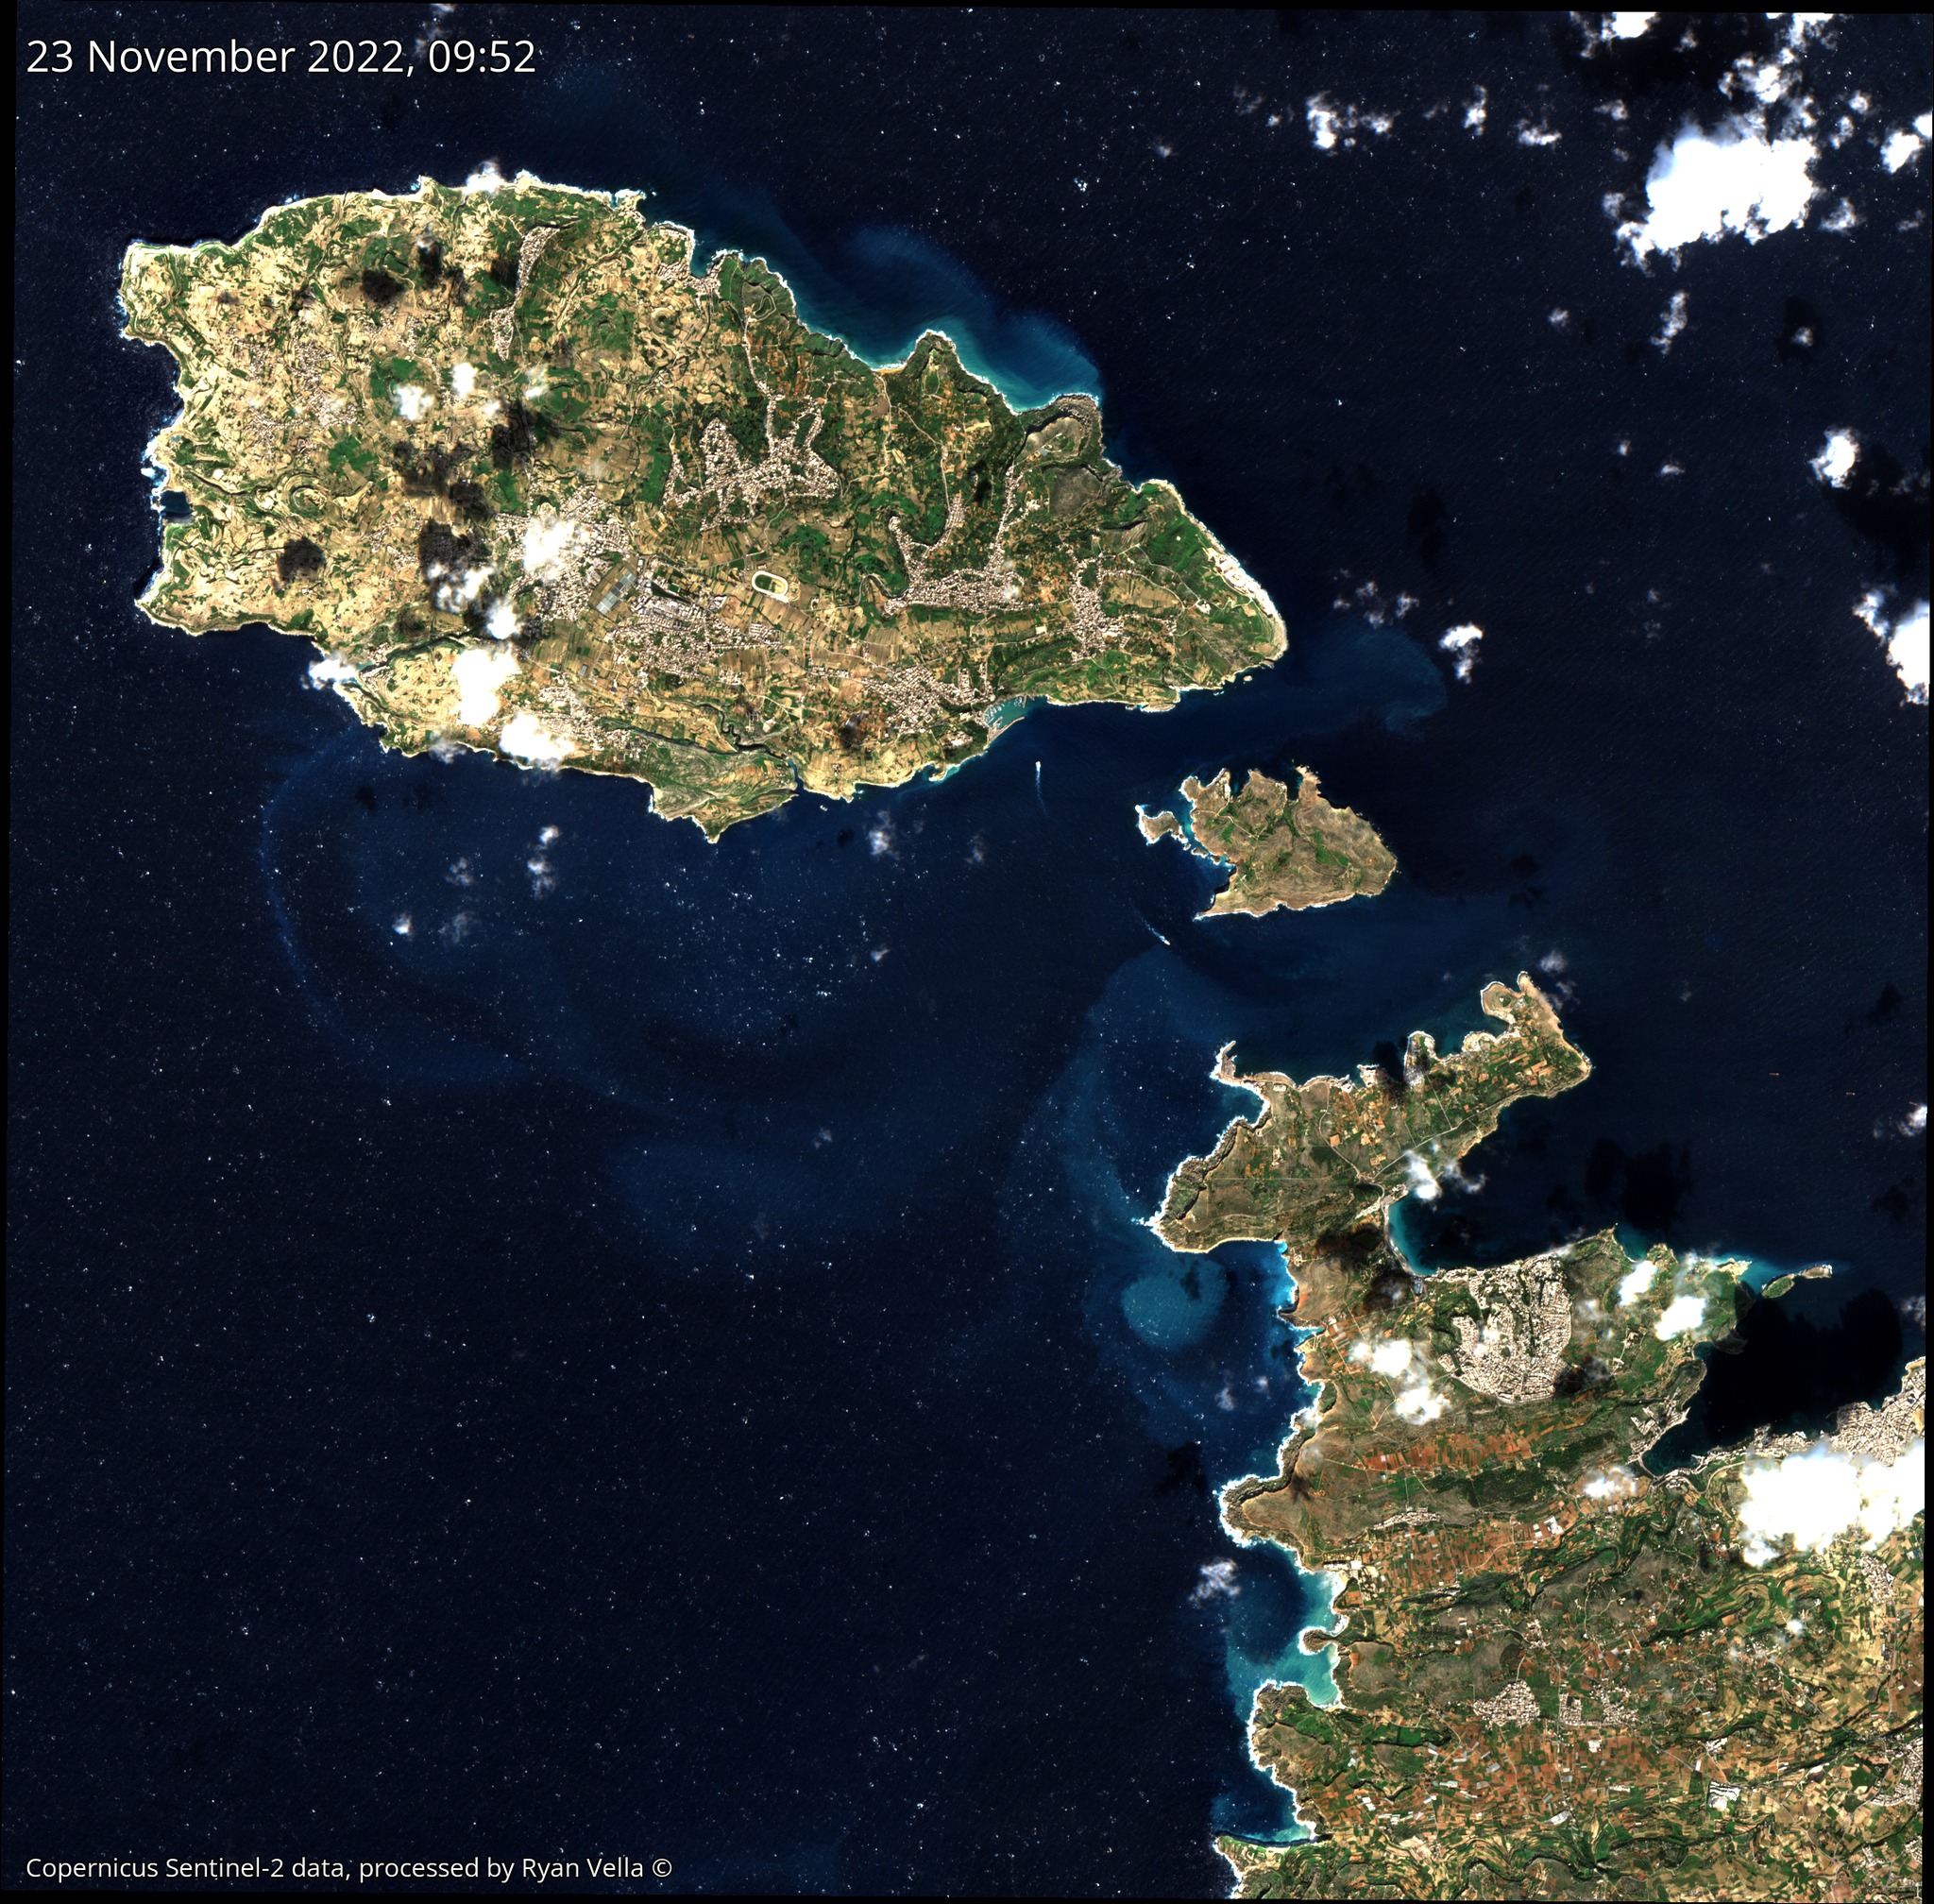
Captured on 23 November 2022, this image shows interesting swirls of turbid water close to the coast of northern Malta.
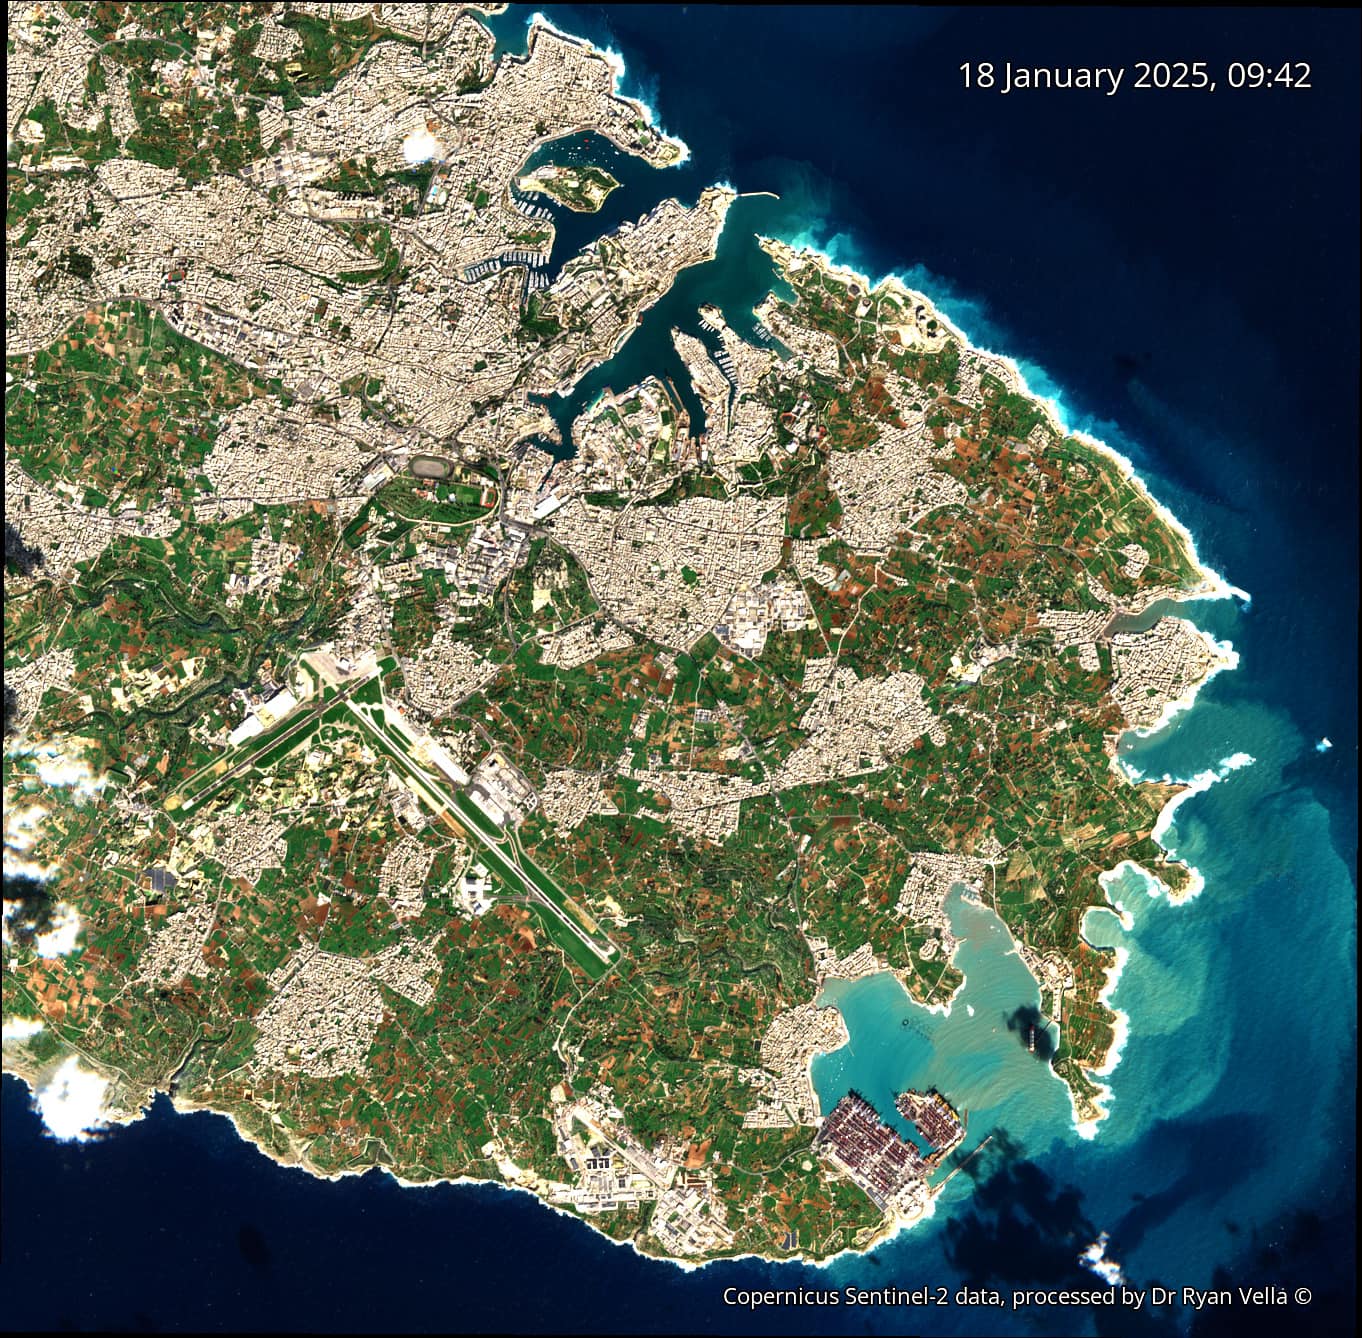
Captured on 18 January 2025, this image shows the southern part of Malta, where a windstorm had stirred up turquoise swirls of turbid water laden with suspended sediment.
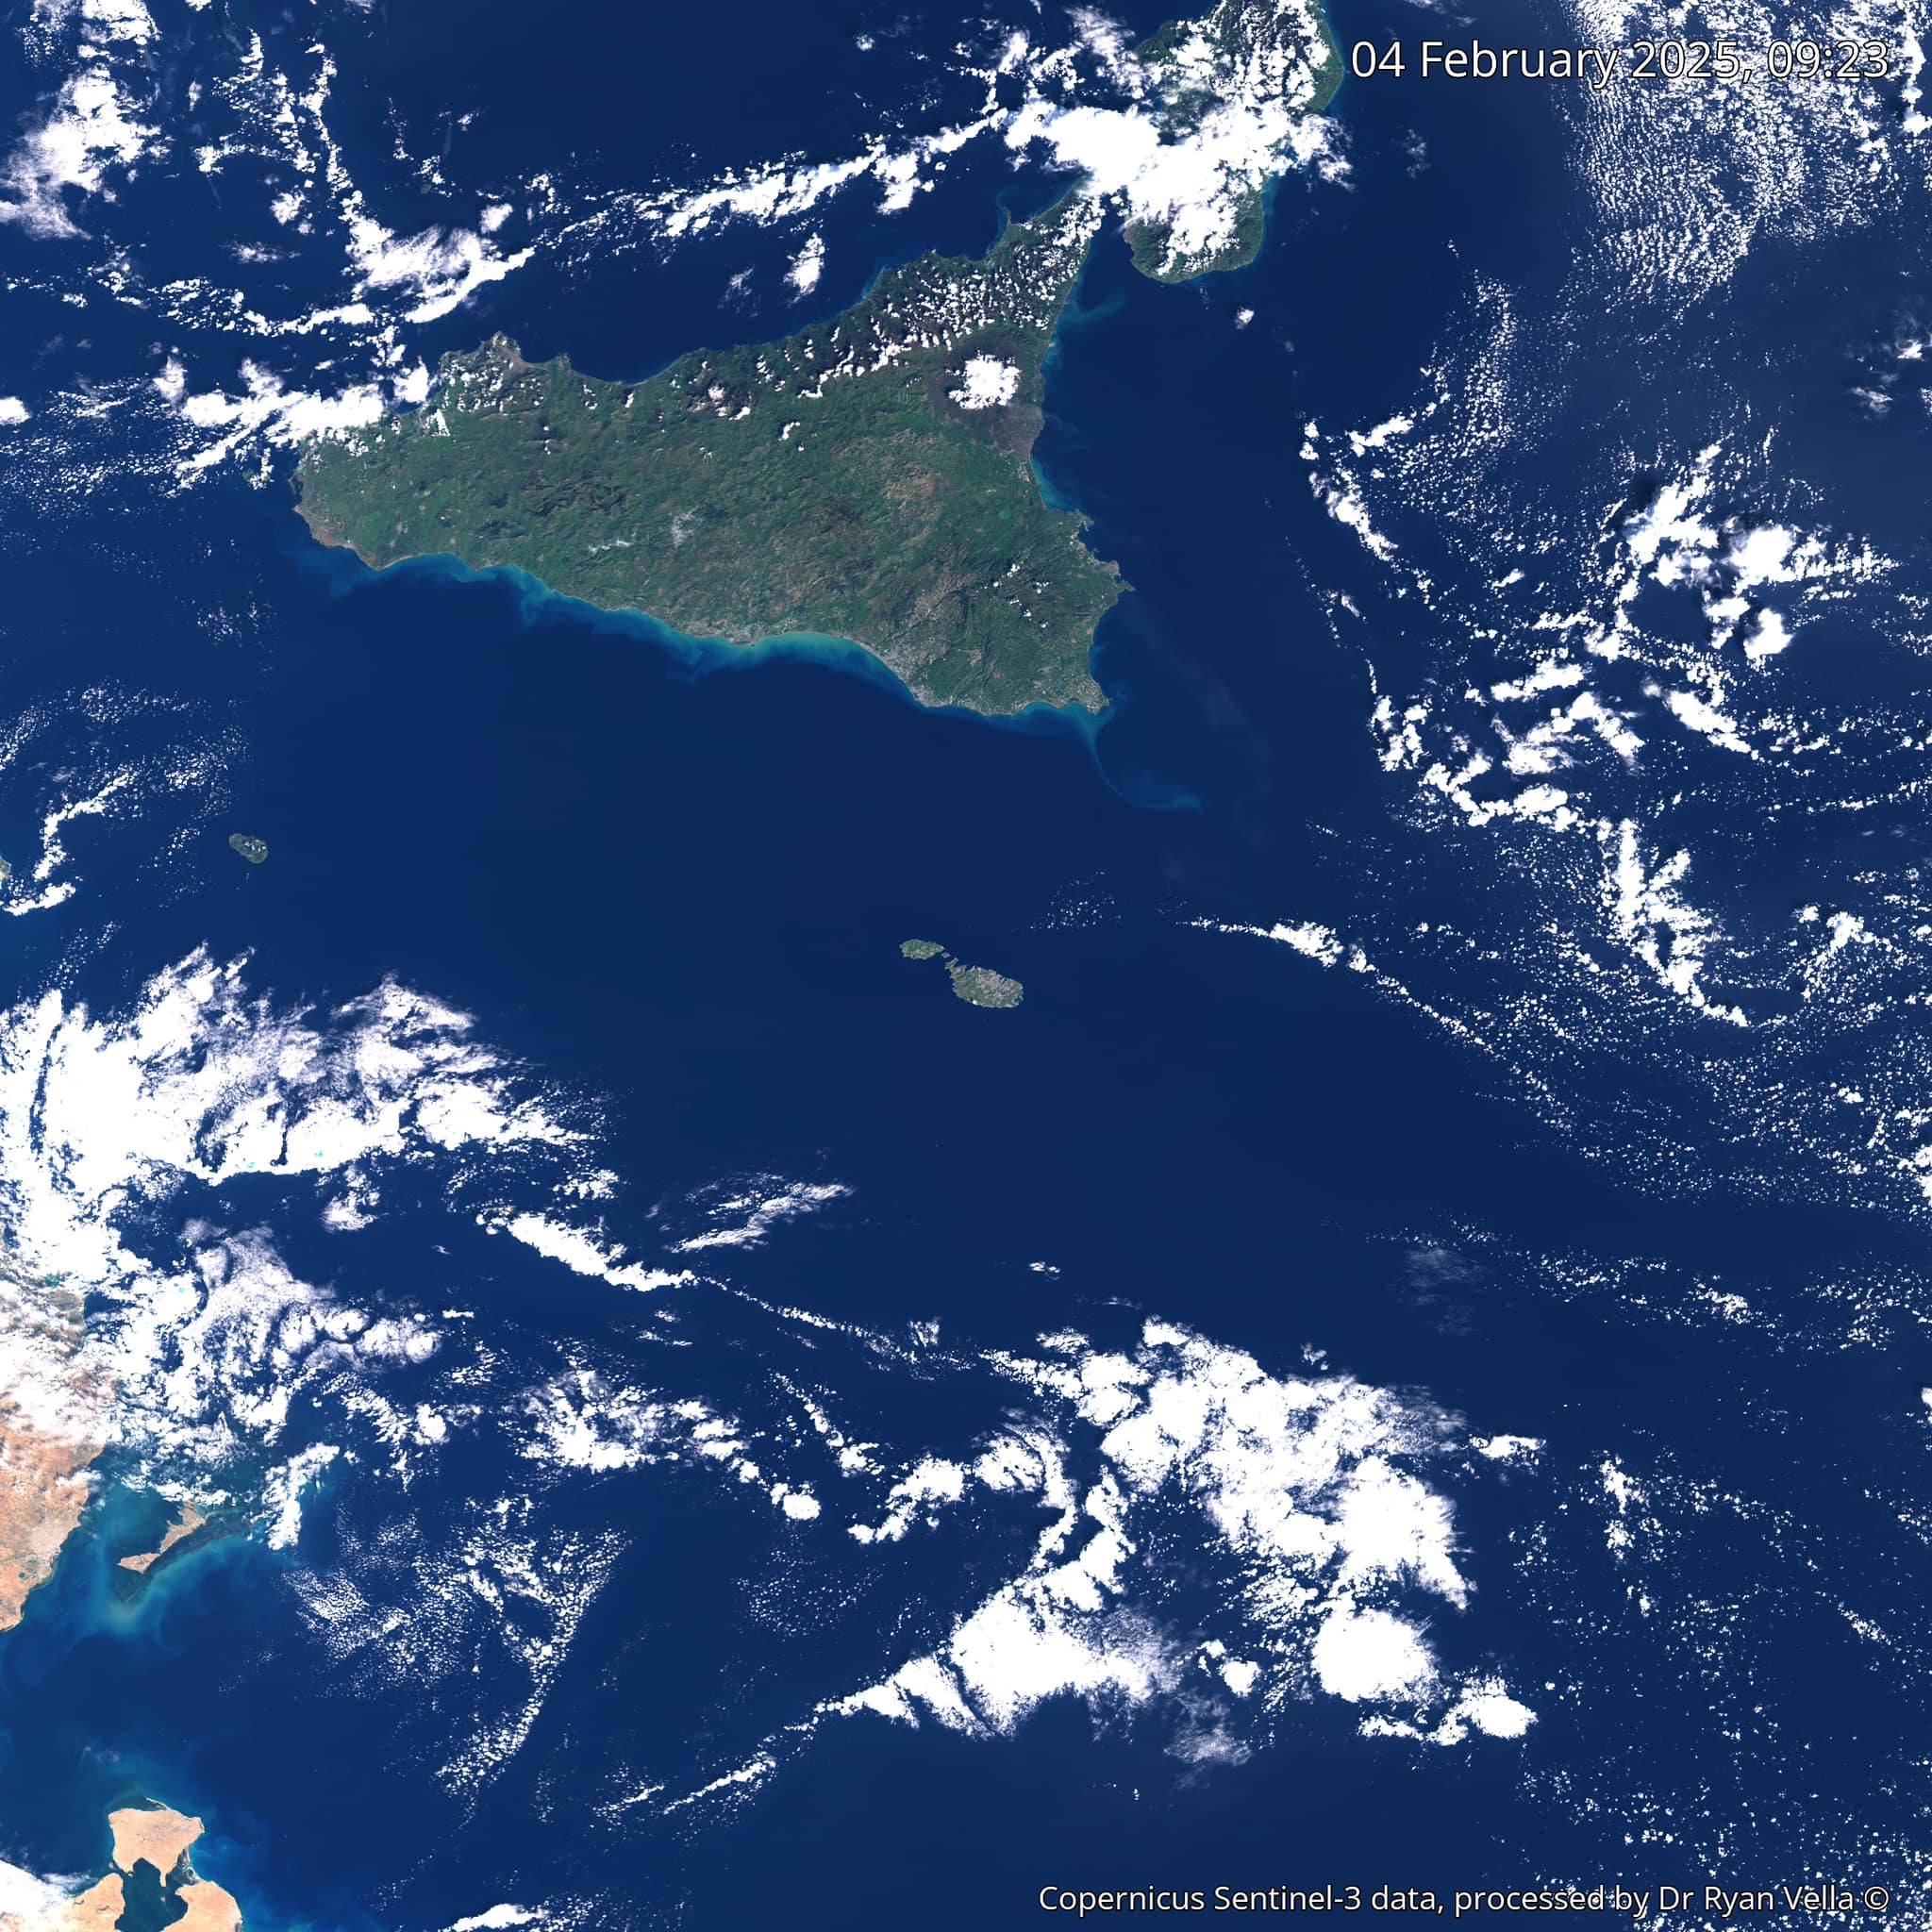
Captured on 4 February 2025, this image shows the Maltese islands in the Mediterranean sea.
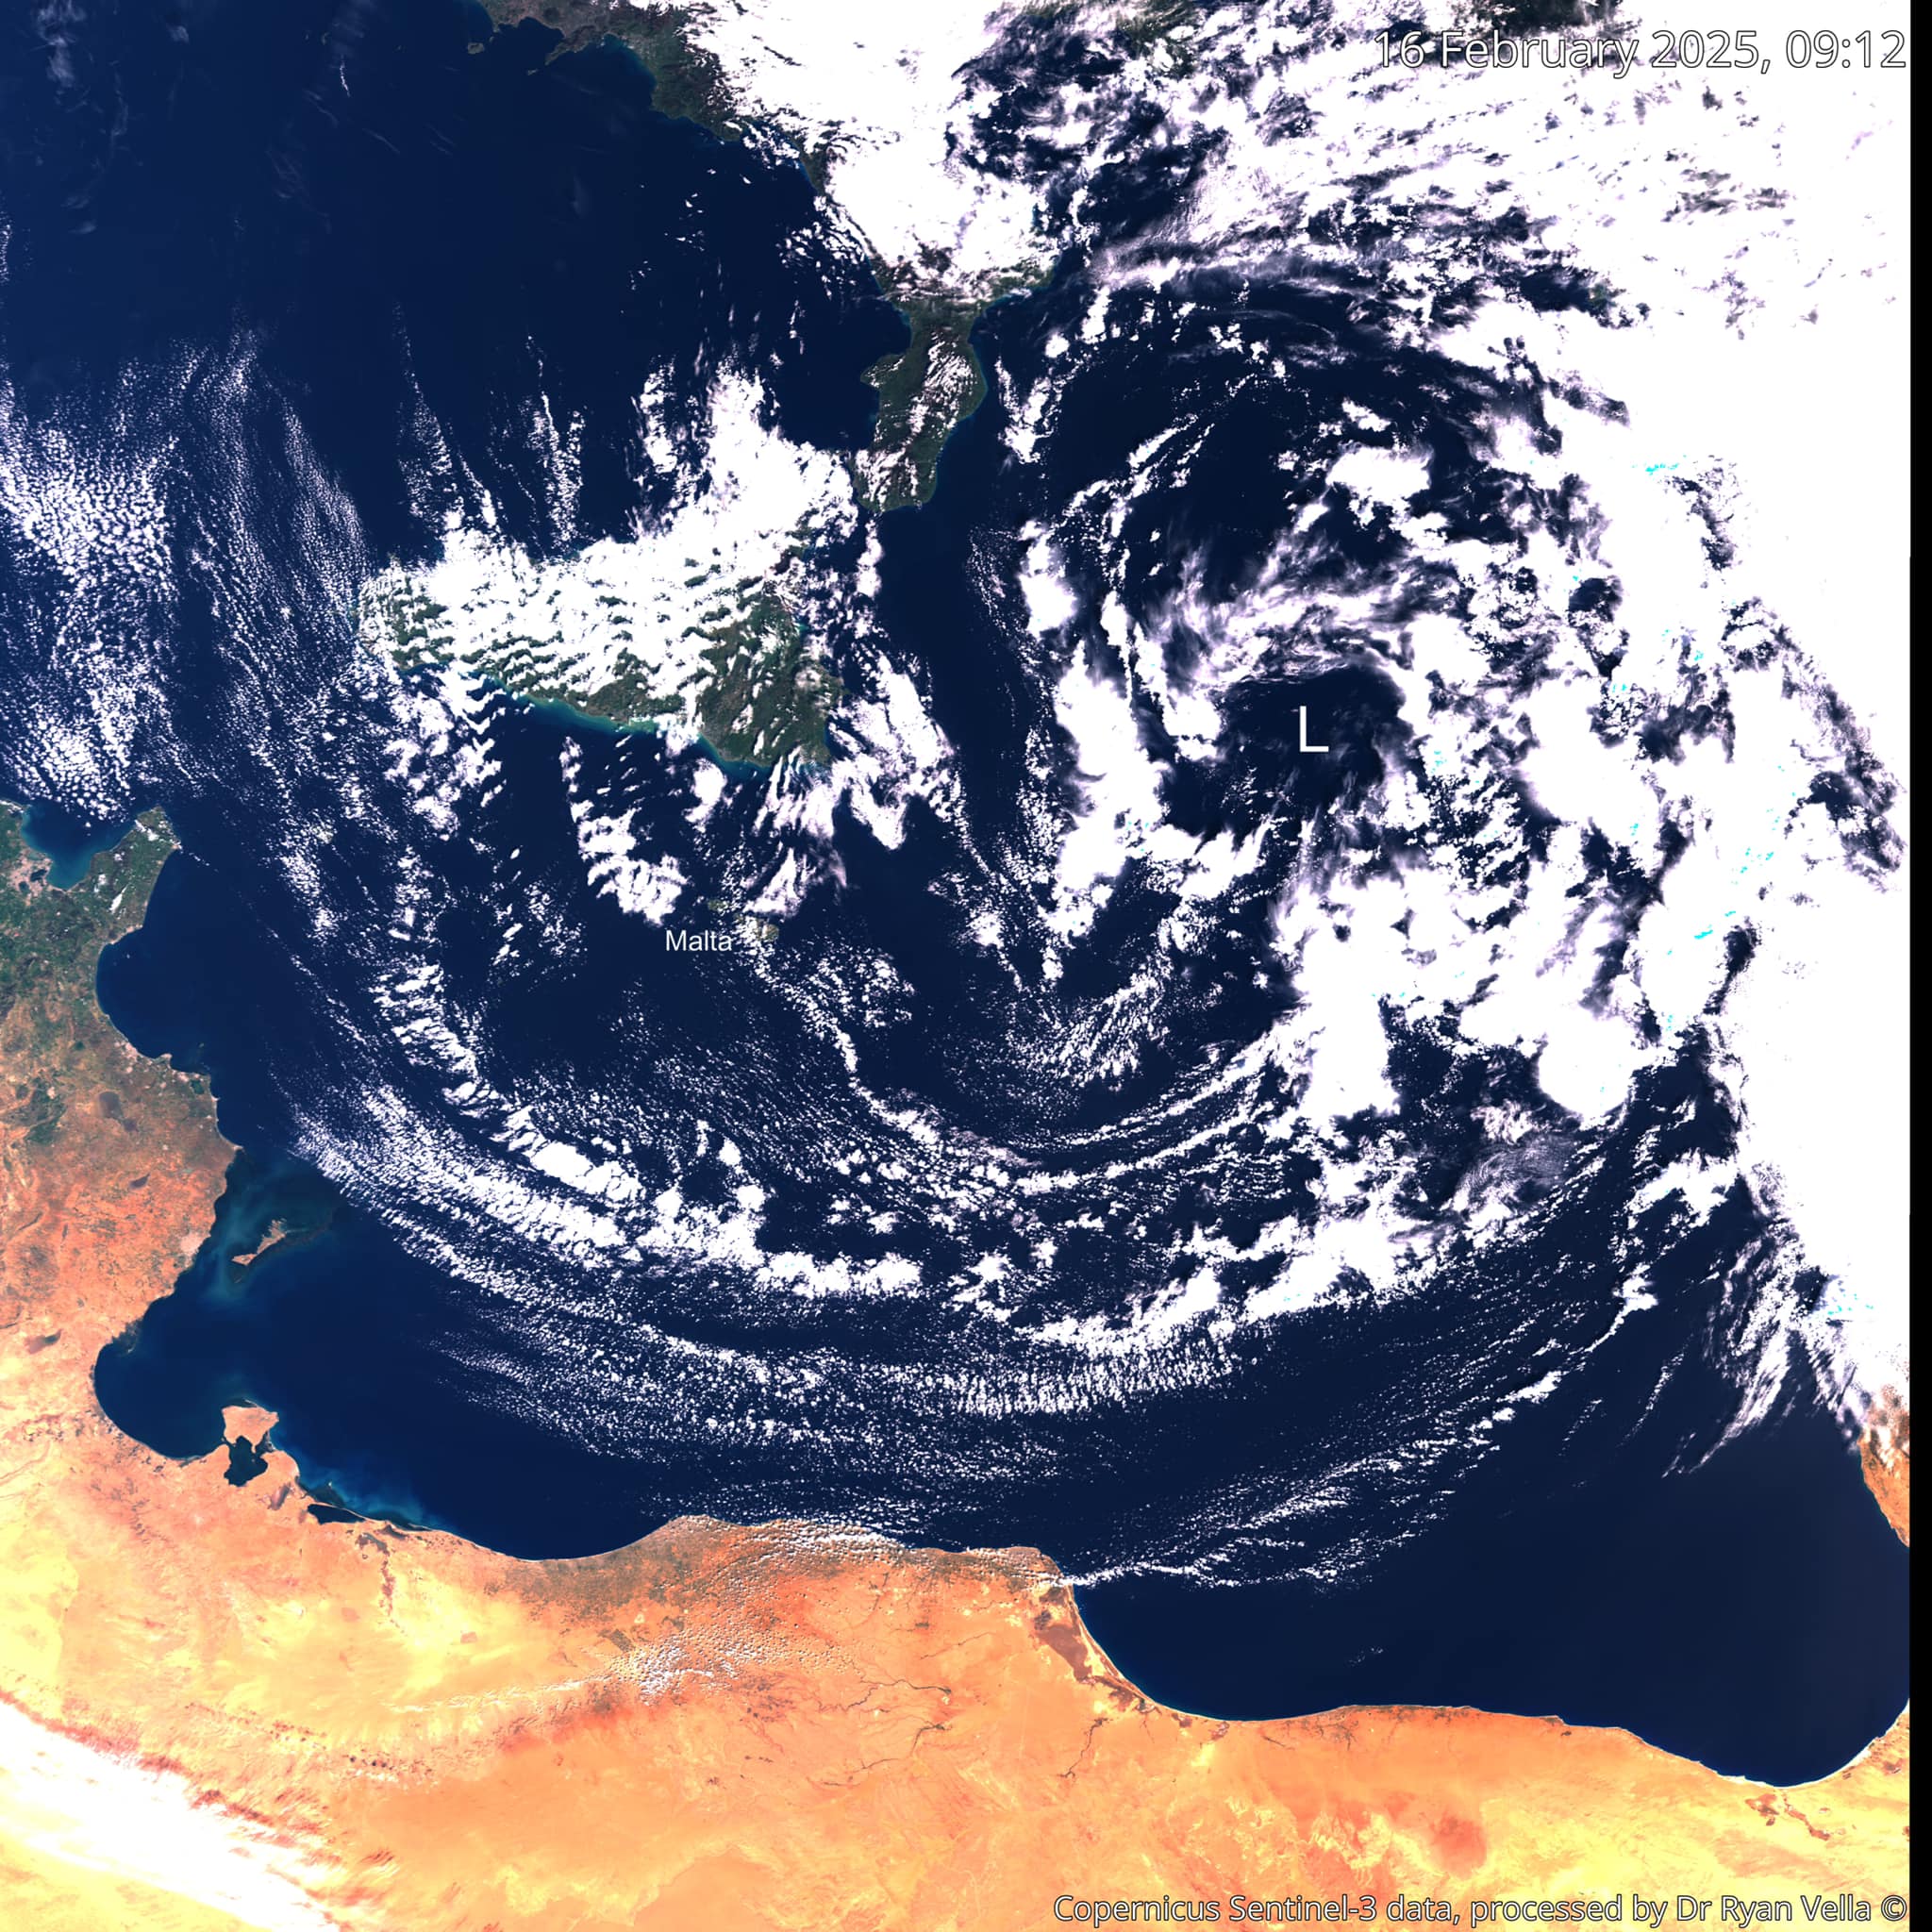
Captured on 16 February 2025, this image shows a low pressure system to the northwest of the islands.
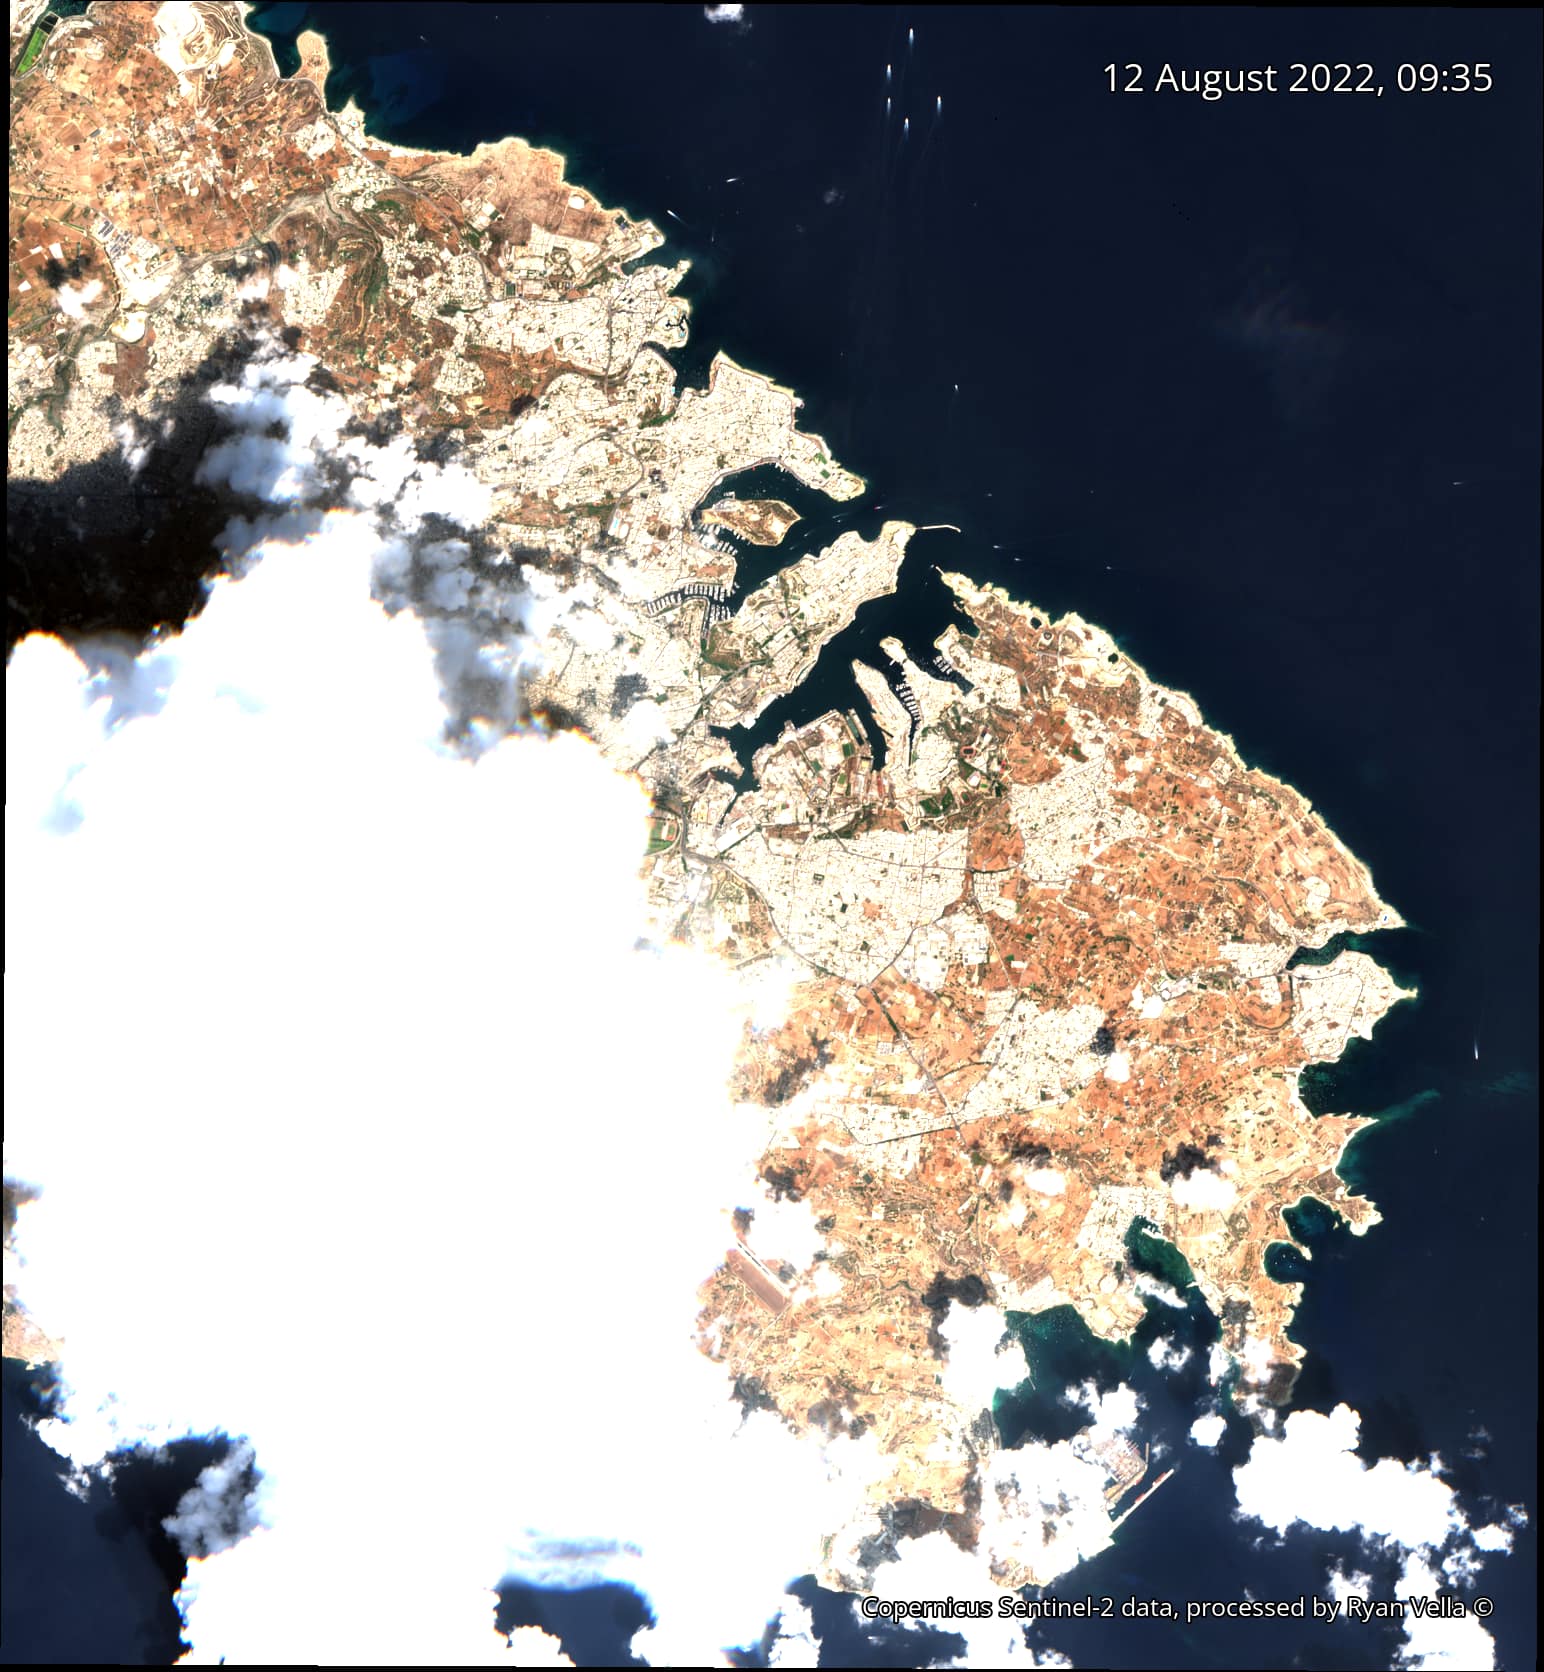
Captured on 12 August 2022, this image shows an isolated convective storm developing over central southwest Malta.
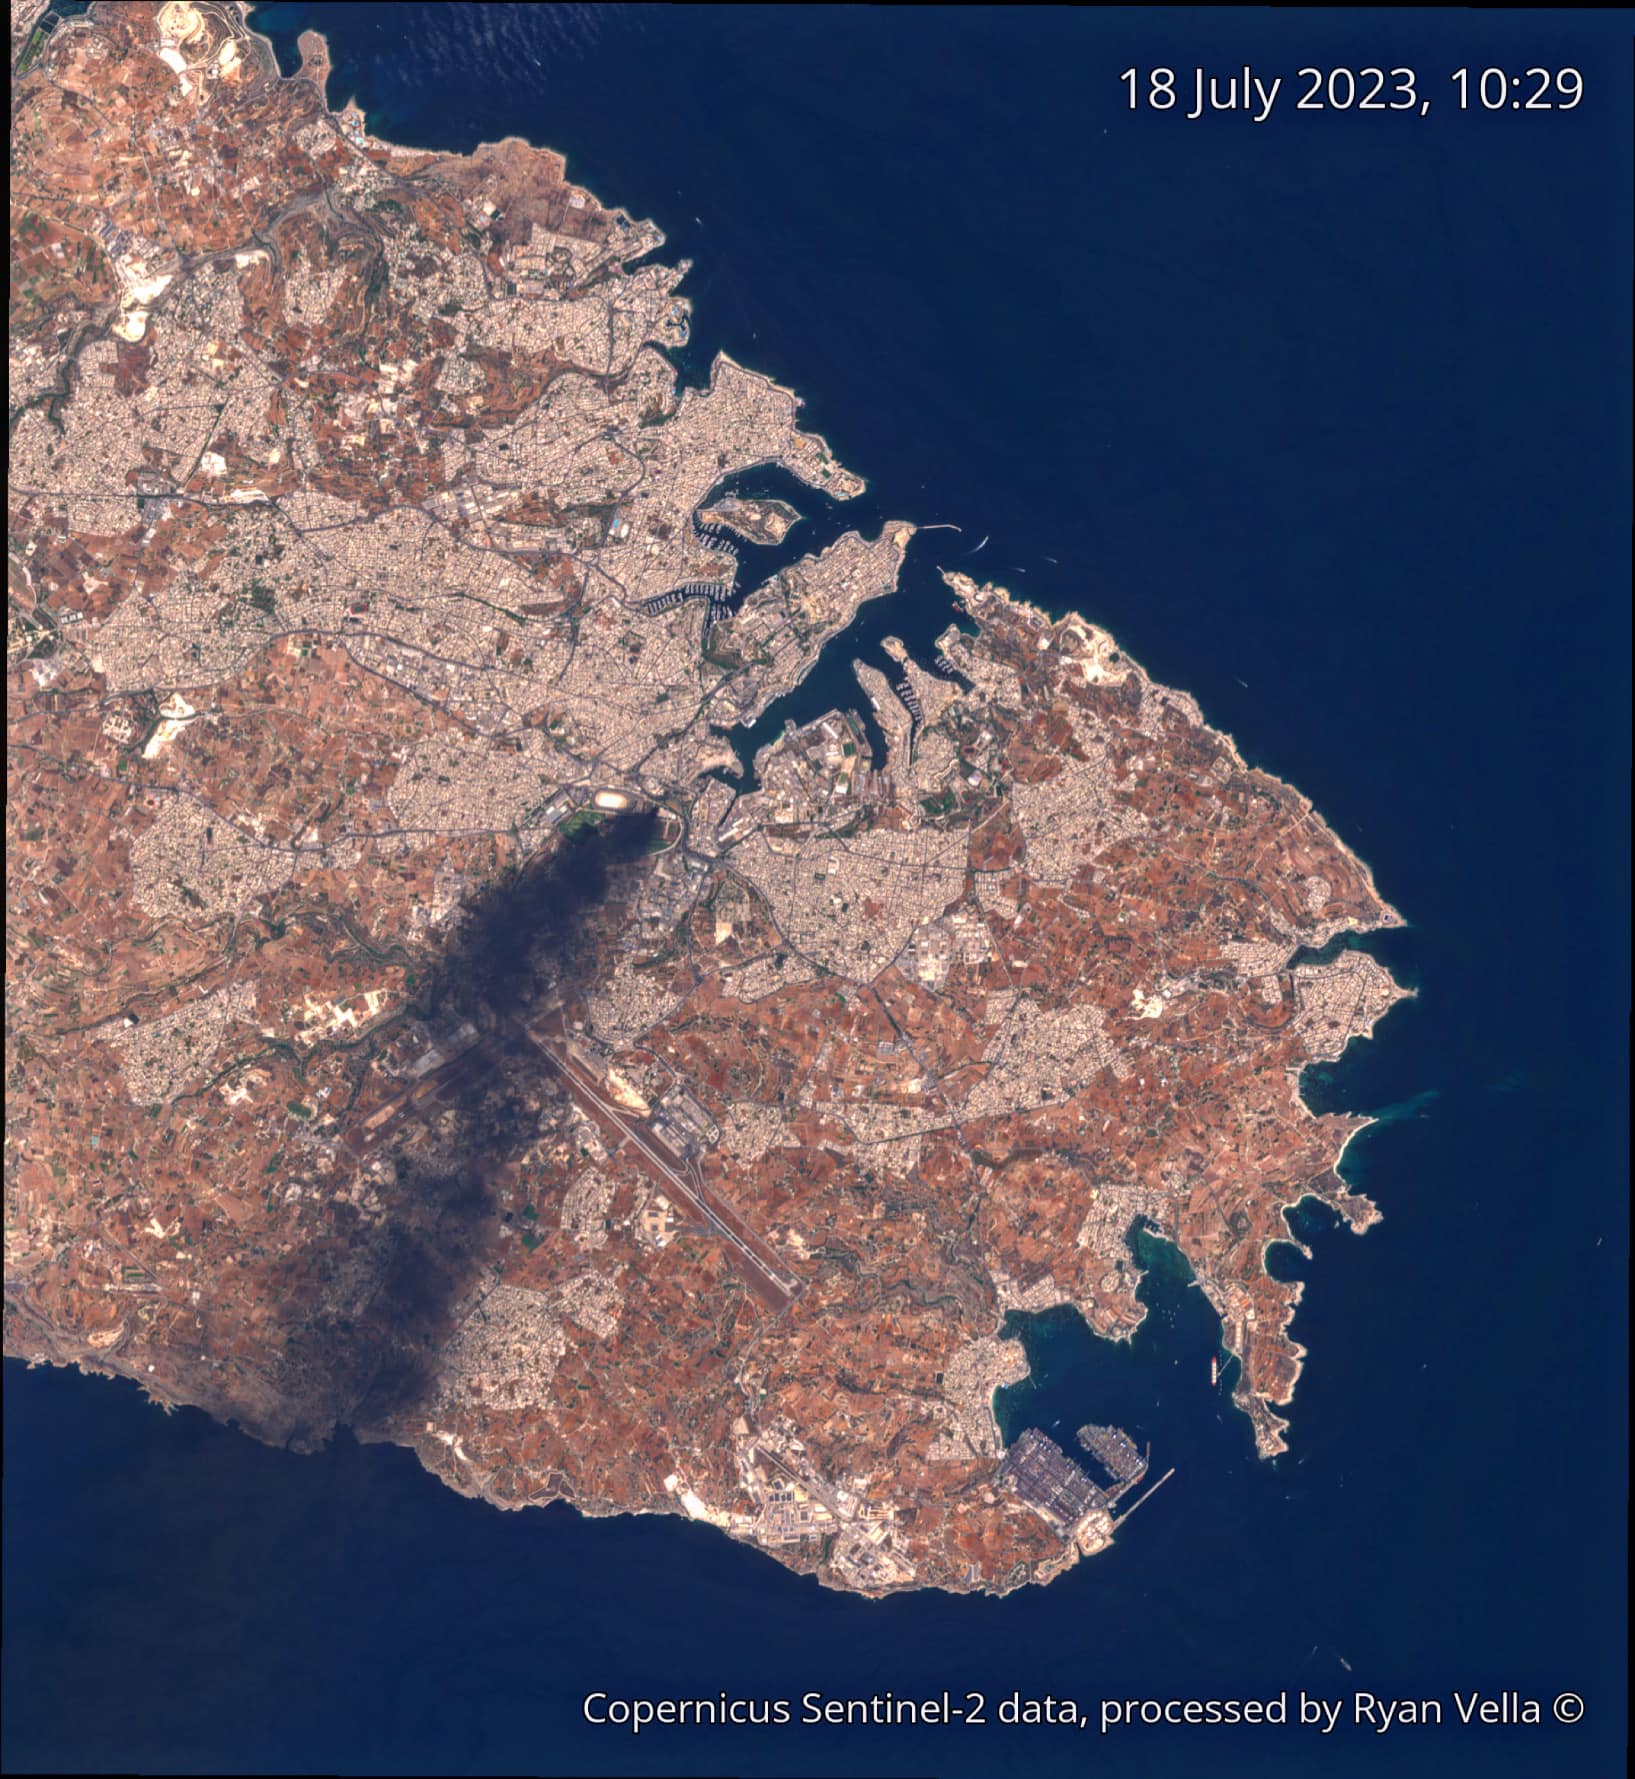
Captured on 18 July 2023, this image shows thick black smoke from a fire outbreak in Marsa, Malta.
Other products
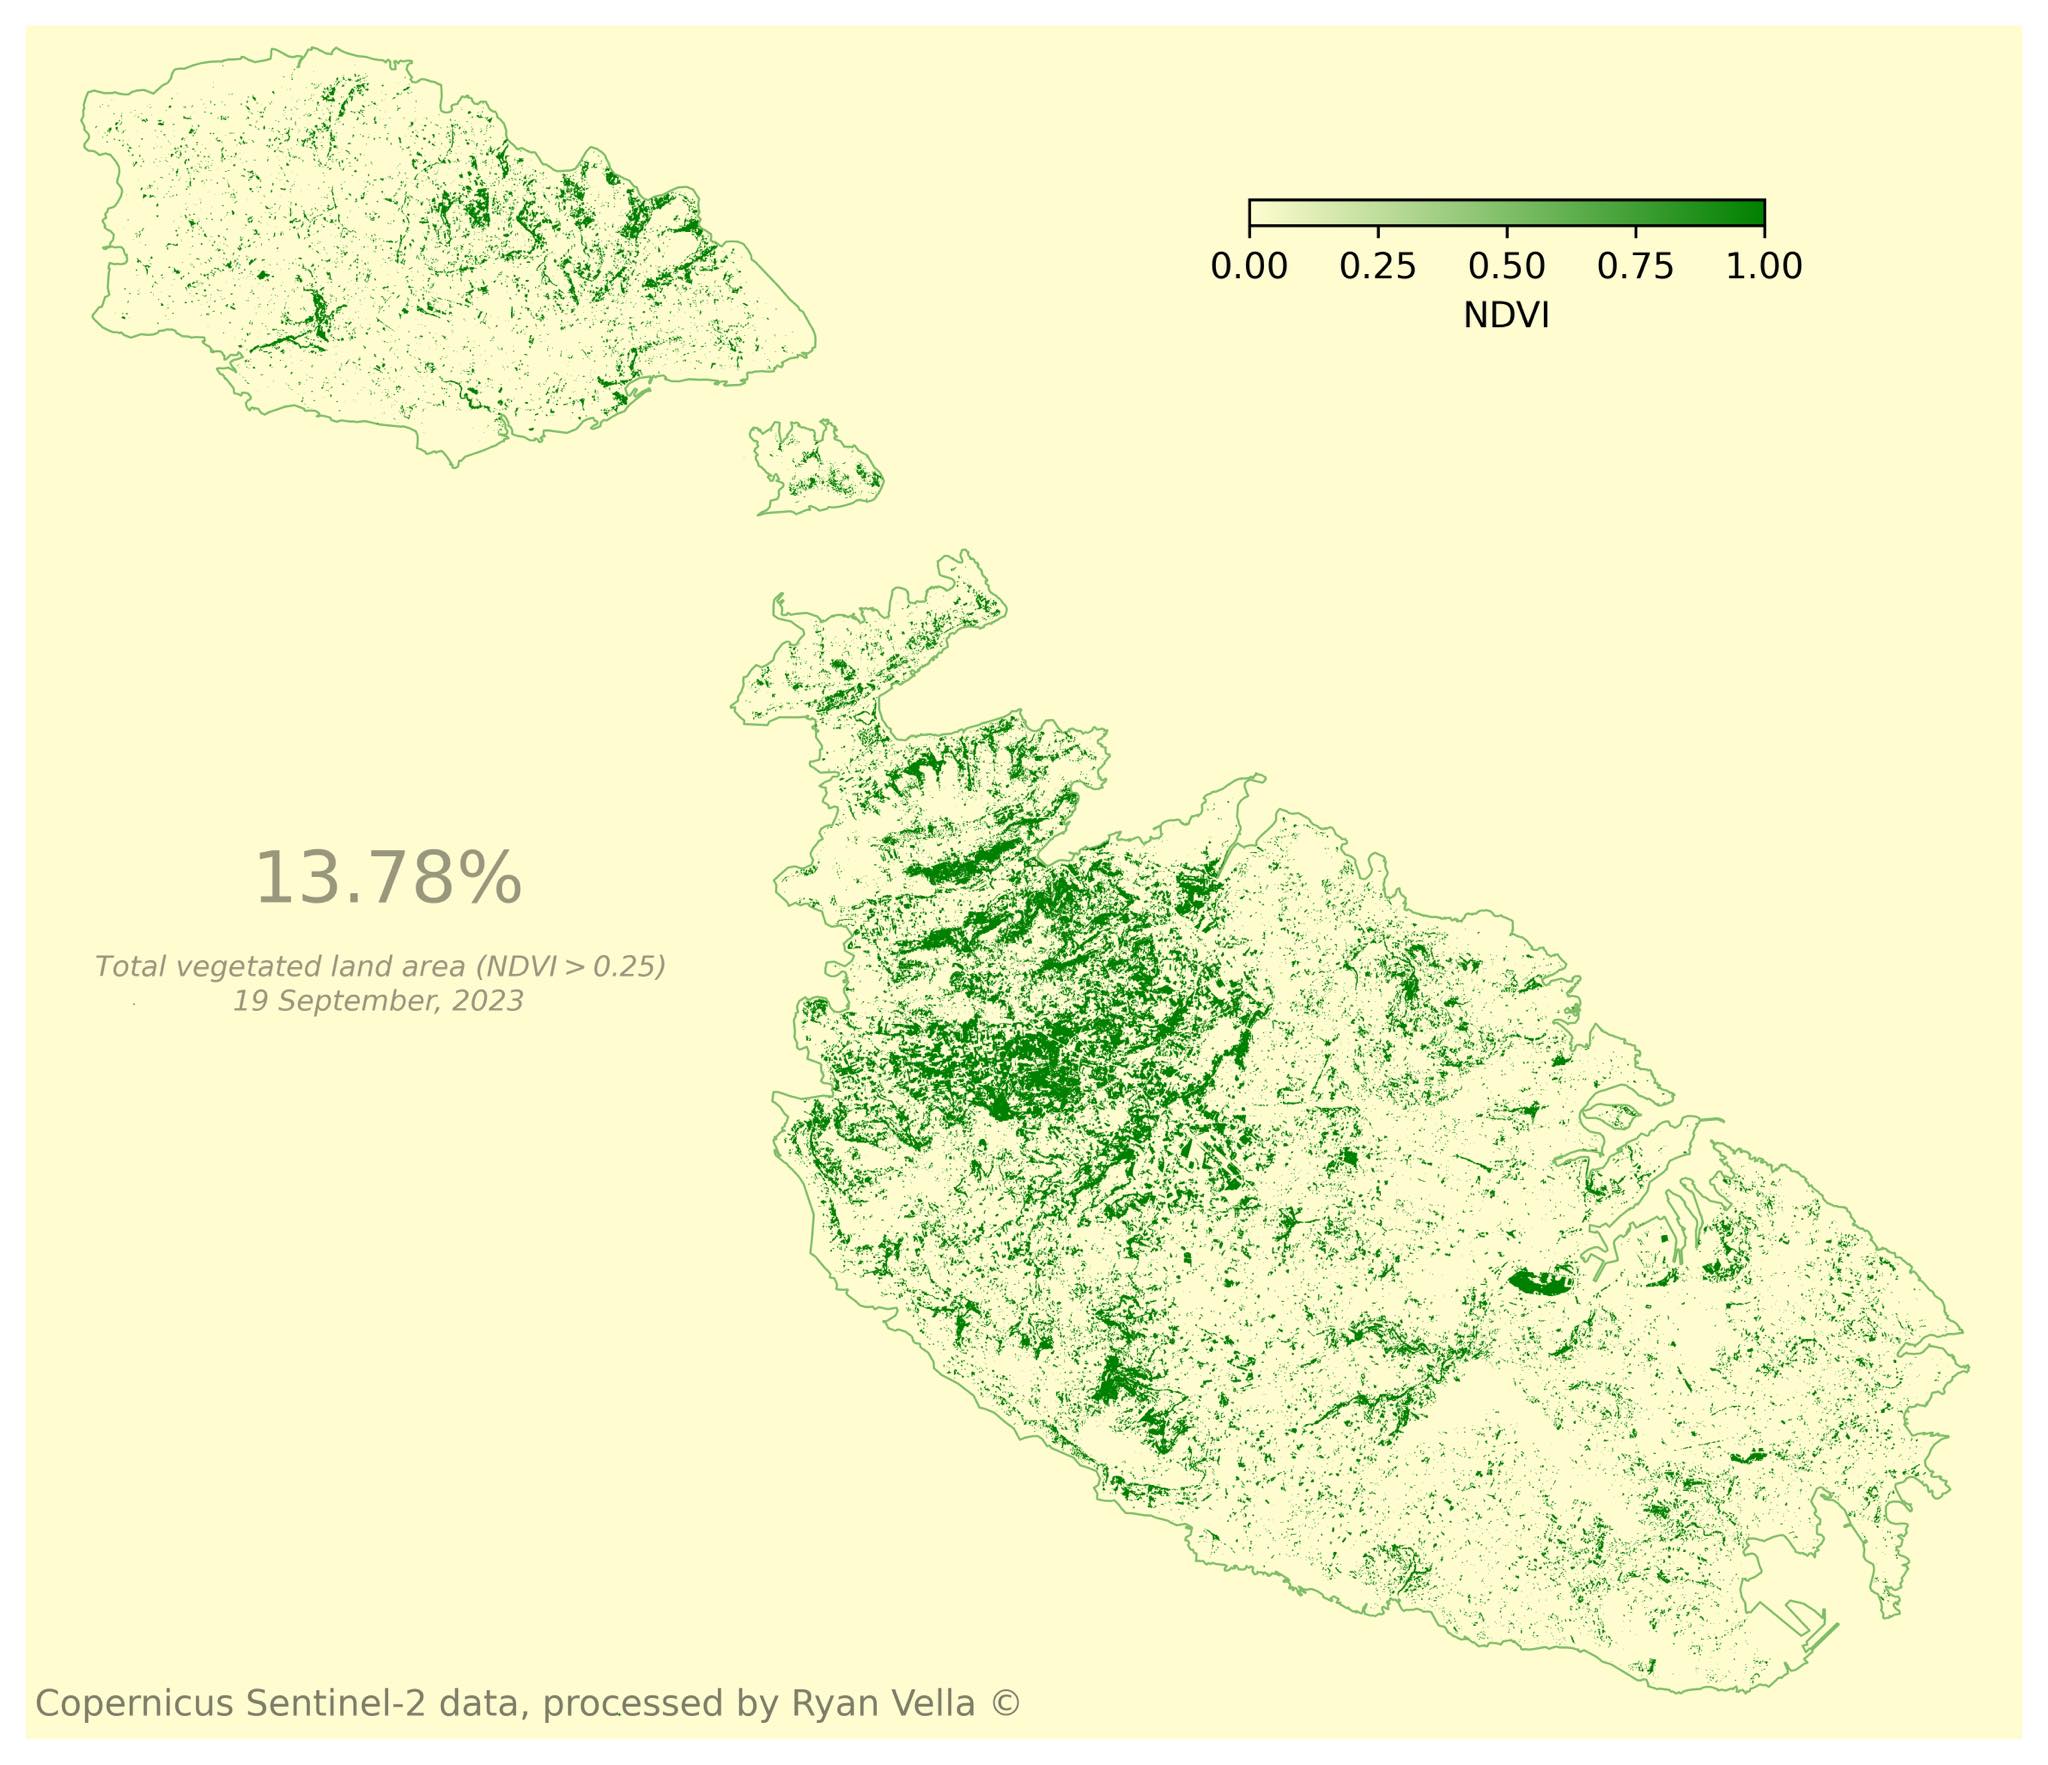
The Normalized Difference Vegetation Index (NDVI) is a numerical indicator obtained from satellites used to assess the vegetation in a specific area. Values approaching 1 indicate dense and healthy vegetation. This image captured on September 19, 2023, provides a visual representation of vegetation distribution across the Maltese Islands. By applying an NDVI threshold of 0.25, we can identify areas with substantial vegetation cover, such as woodlands, agricultural land, and urban parks. These areas collectively account for only 13.78% of the total land area.
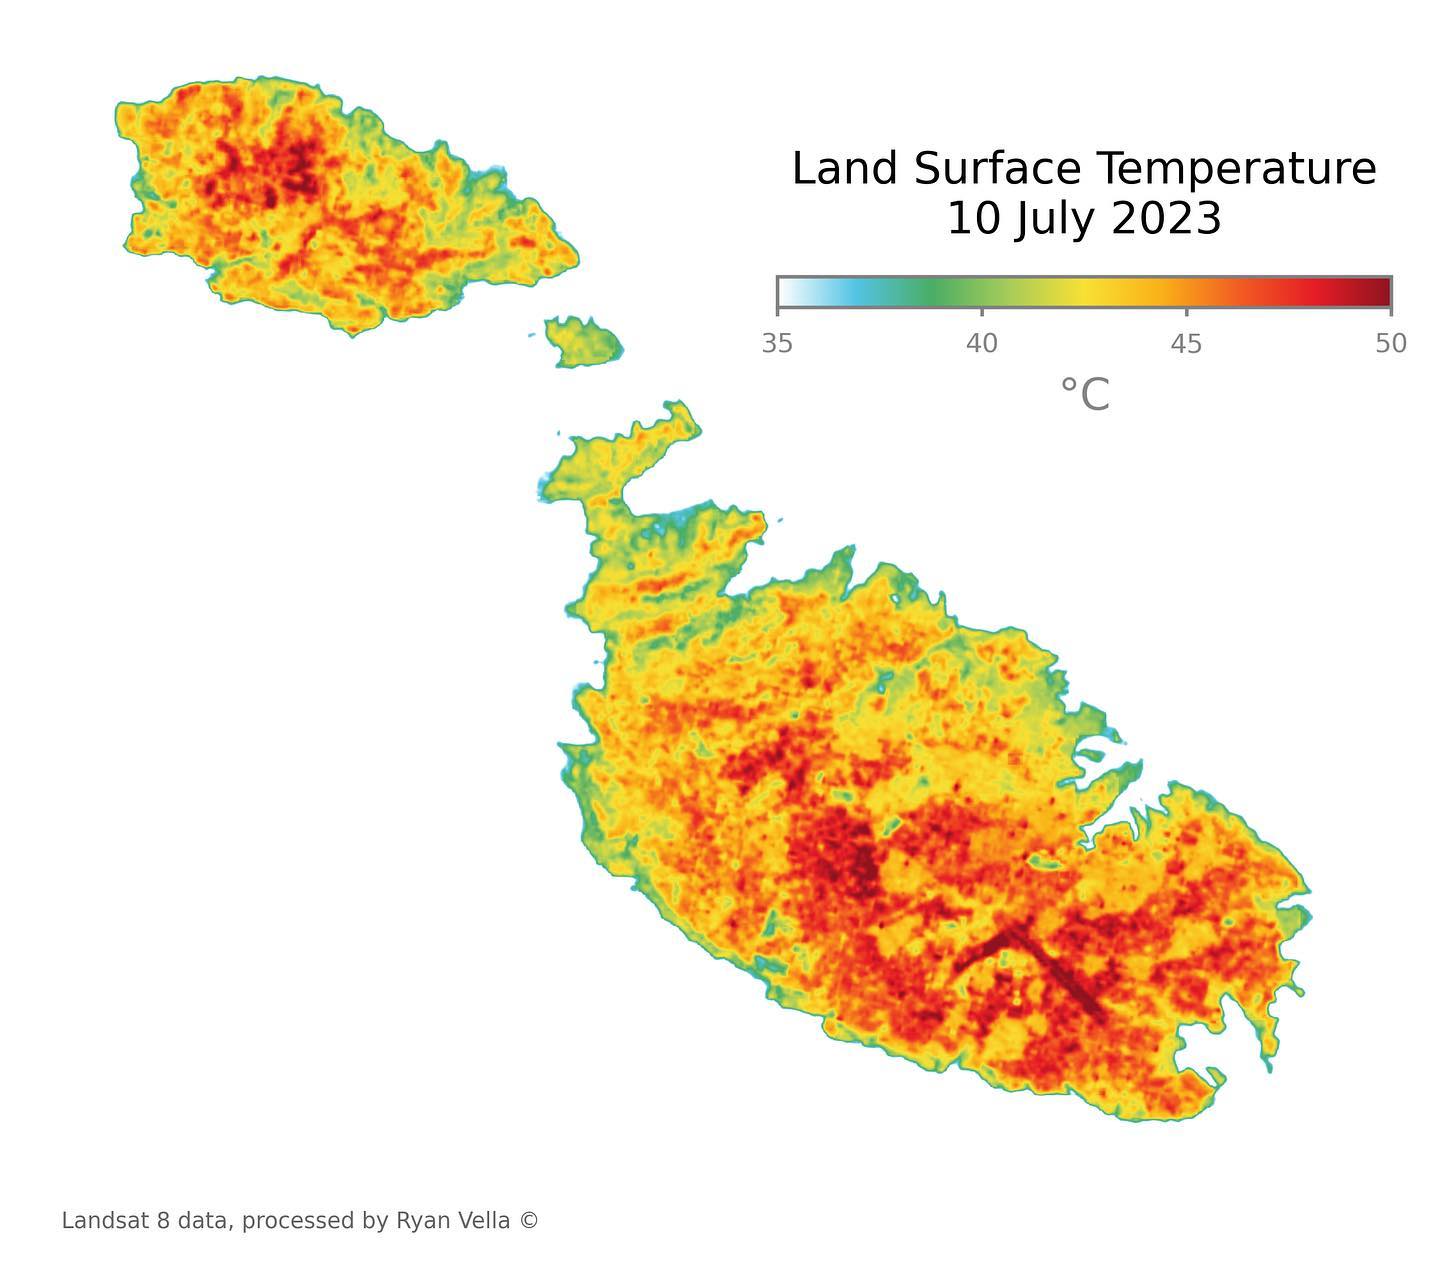
This thermal infrared image was derived from Landsat 8 TIRS (Thermal Infrared Sensor) Band 10 data captured on July 10th, 2023. Land surface temperatures (LST) were calculated using the radiative transfer equation with atmospheric correction parameters. The analysis reveals extreme thermal conditions with LST values exceeding 50°C in urban and exposed rocky areas. Temperature variations correlate with land cover types, with vegetated areas showing cooler temperatures due to evapotranspiration processes.